|
|
|
|
Mulvane Cooperative
Cash Bids
Market Data
News
Ag Commentary
Weather
Resources
|

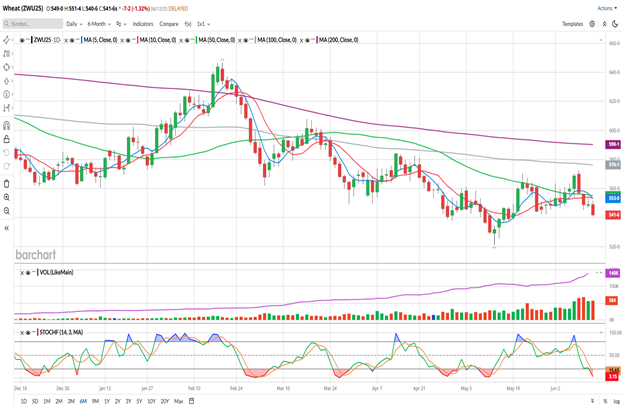
Chart of the Day - September Wheat
The information and opinions expressed below are based on my analysis of price behavior and chart activity Thursday, June 12, 2025 If you like this article and would like to receive more information on the commodity markets, please use the link to join our email list -Click here Every morning, at about 8 AM CST, I post a short video highlighting where I see opportunities in the futures markets. You can view my most recent video here September Wheat (Daily)
Today, September Wheat (Chicago) closed at 5.41 ¾, dropping 7 ¼ cents on the day. We saw the market finish last week on a strong note, above the 50-day moving average (green, 5.55 today) but this market has been working lower since Monday’s open at 5.70. It appears to me that the 50-day average has been solid resistance since March. The short-term moving averages on the chart, the 5- and 10-day (blue/red, 5.53 and 5.53 3/8, respectively) made a bearish crossover today and the Stochastics (bottom sub-graph) flashed into oversold territory. Today’s close was the lowest since May 19th, some 18 trading days ago. Harvest of the Winter Wheat crop has begun, with Monday’s Crop Progress report indicating that 4% complete. That is a bit behind schedule, as the 5-year average is 7%, but I’m not certain that the delays will last long. If the weather is cooperative, in my experience, it won’t take long for the combines to catch up. Today’s WASDE report didn’t result in any yield adjustment, but US Ending Stocks dropped from 898 million bushels, from 923 million last month. That wasn’t enough, apparently, to get the bulls excited today. And when there’s nothing to get the bullish traders fired up, I’m of the opinion that gravity will pull prices lower. Aggressive and well-margined traders may do well to consider short positions in the September Wheat futures. Perhaps profit targets near the contract low of 5.21 ¼ or even 5.00 may prove to be effective. A risk/reverse Buy Stop at or near the 50-day moving average could be useful, as well. Wheat producers that need some additional downside protection, may do well to consider buying September Put Options. Those expire in 71 days. The 5.20 Puts closed at 12 3/8 today, or $618.75 before commissions/fees. If you’d prefer something closer to the money, the 5.40 Puts settled at 21 7/8 today, or $1,093.75 before commissions/fees. If you pay attention to the Option Delta, I think you might find that 2 or more of the 5.20’s will serve you better than 1 of the 5.40’s. Barring outside market influence (war, pandemic, some other unusual nonsense, etc.) I don’t see a lot to be bullish about in Wheat right now. If you like what you’ve read here and would like to see more like this, please Click here and sign up for our daily futures market email. Every morning, at about 8 AM CST, I post a short video highlighting where I see opportunities in the futures markets. You can view my most recent video here September Wheat (Weekly)
Today, the September Wheat contract settled at 5.41 ¾, down 27 cents on the week. There’s still another trading day left in the week, but as of this writing, September Wheat is working on a Bearish Engulfment. As you might guess from the name, that’s not usually a bullish sign. We saw the market open the week higher than last Friday’s close and are currently trading lower than last weeks low. In fact, prices are currently below the low of the past 2 weeks, and are only 3 ¼ cents from 3-week lows. For reference, the 4-week low is 5.21 ¼ and that’s also the contract low. You might notice, by looking that the chart, that this market has been in a fairly consistent downtrend. The short-term averages, the 5- and 10-week moving average are both above the market, at 5.51 ¼ and 5.57, respectively. Those two have been in a bearish configuration since (roughly) the middle of March. The 50-week average (green, 5.92 ¼ appears to have held as staunch resistance since that moving average showed up last June. The 100-week average (grey, 6.33) has only been available for calculation for the past two weeks. Weekly stochastics (bottom sub-graph) are hooking back toward oversold territory, as well. Looking back, you might agree that the Wheat market has spent much more time being oversold than overbought, over the life of this chart. According to Barchart’s Seasonal data Wheat prices tend to decline in June, more often than not, before chopping a bit sideways in the month of July. At the moment, this weekly chart doesn’t give me any bullish read and I think that we’ll see new contract lows in the coming weeks. If you like what you’ve read here and would like to see more like this, please Click here and sign up for our daily futures market email. Every morning, at about 8 AM CST, I post a short video highlighting where I see opportunities in the futures markets. You can view my most recent video here Jefferson Fosse Walsh Trading Direct 312 957 8248 Toll Free 800 556 9411 jfosse@walshtrading.com www.walshtrading.com Walsh Trading, Inc. is registered as a Guaranteed Introducing Broker with the Commodity Futures Trading Commission and an NFA Member. Futures and options trading involves substantial risk and is not suitable for all investors. Therefore, individuals should carefully consider their financial condition in deciding whether to trade. Option traders should be aware that the exercise of a long option will result in a futures position. The valuation of futures and options may fluctuate, and as a result, clients may lose more than their original investment. The information contained on this site is the opinion of the writer or was obtained from sources cited within the commentary. The impact on market prices due to seasonal or market cycles and current news events may already be reflected in market prices. PAST PERFORMANCE IS NOT NECESSARILY INDICATIVE OF FUTURE RESULTS. All information, communications, publications, and reports, including this specific material, used and distributed by Walsh Trading, Inc. (“WTI”) shall be construed as a solicitation for entering into a derivatives transaction. WTI does not distribute research reports, employ research analysts, or maintain a research department as defined in CFTC Regulation 1.71. This article contains syndicated content. We have not reviewed, approved, or endorsed the content, and may receive compensation for placement of the content on this site. For more information please view the Barchart Disclosure Policy here.
|
|
|